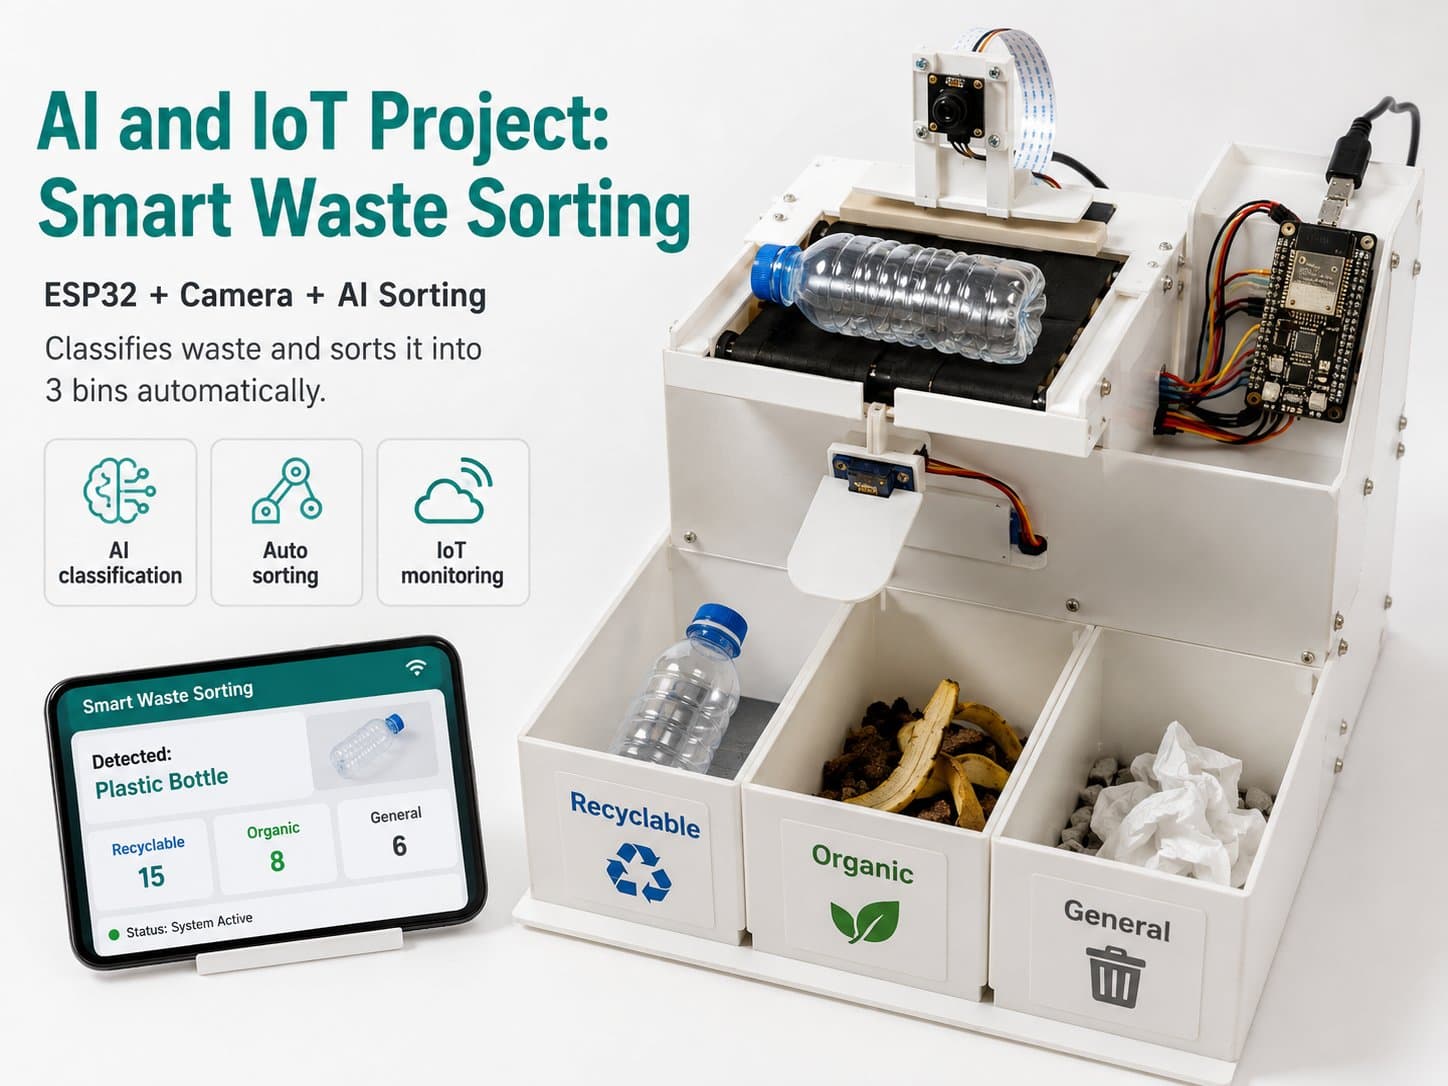
Part 5: Connecting to IoT and Building the Dashboard
1. Introducing MQTT and its role in the project; 2. Writing code to send data over MQTT; 3. Building a dashboard to track data; 4. Integrating a mislabel-correction and retraining feature; 5. Testing and evaluating the system; 6. How to maintain and improve the system.
Part 5: Connecting to IoT and Building the Dashboard
1. Introducing MQTT and Its Role in the Project
MQTT (Message Queuing Telemetry Transport) is a lightweight messaging protocol, ideal for IoT applications. It lets devices connect and communicate efficiently over a network, especially in bandwidth-constrained environments.
In the smart waste-sorting project, MQTT is used to send data from the Raspberry Pi to a server or dashboard. This data includes the image, the waste type, the confidence level, and sensor information.
2. Writing Code to Send Data over MQTT
To send data over MQTT, you need the PubSubClient library for Arduino, while the Raspberry Pi (Python) uses paho-mqtt. Below is a sample using Python with the paho-mqtt library:
import paho.mqtt.client as mqtt
import json

# Thông tin kết nối
broker = "mqtt.example.com"
port = 1883
topic = "trash_classification"

# Hàm publish dữ liệu
def publish_data(data):
    client = mqtt.Client()
    client.connect(broker, port, 60)
    client.publish(topic, json.dumps(data))
    client.disconnect()

# Dữ liệu mẫu
data = {
    "image": "trash_2024_06_07_001.jpg",
    "type": "plastic",
    "confidence": 0.82
}

publish_data(data)
3. Building a Dashboard to Track Data
The dashboard can be built with tools like Grafana, or using the IoTLabs MQTT dashboard. It will show data such as the number of items sorted, the waste type, and prediction confidence.
To connect the dashboard to MQTT, configure it to receive data from the topic the Raspberry Pi publishes to. Note that Grafana doesn't support MQTT directly — you need a bridge like Telegraf or Node-RED to move data from MQTT into a database Grafana can read.
4. Integrating a Mislabel-Correction and Retraining Feature
The mislabel-correction feature lets users fix inaccurate AI predictions. This data is saved and used to retrain the model, improving accuracy over time.
Users can enter the correct label, and the system stores this information in a database to support fine-tuning the model.
5. Testing and Evaluating the System
To evaluate the system's performance, run periodic tests, tracking the AI's accuracy and the sensors' performance. Use metrics like accuracy, sensitivity, and specificity to evaluate it.
Note: make sure all data is recorded accurately before using it to retrain the model.
6. How to Maintain and Improve the System
Maintaining the system includes regularly checking hardware and software components, updating the AI model with new data, and improving the dashboard's interface. Schedule regular maintenance to keep the system running reliably.
The system can be improved by gathering more data, optimizing the AI model, and improving the sorting algorithms.