Detailed guide
Part 7: Testing MQTT, Building a Dashboard, and Extension Ideas
Guides you through checking MQTT data with MQTT Explorer, designing a dashboard, and the project completion checklist.
Updated 31/08/2026
Part 7: Testing MQTT, Building a Dashboard, and Extension Ideas
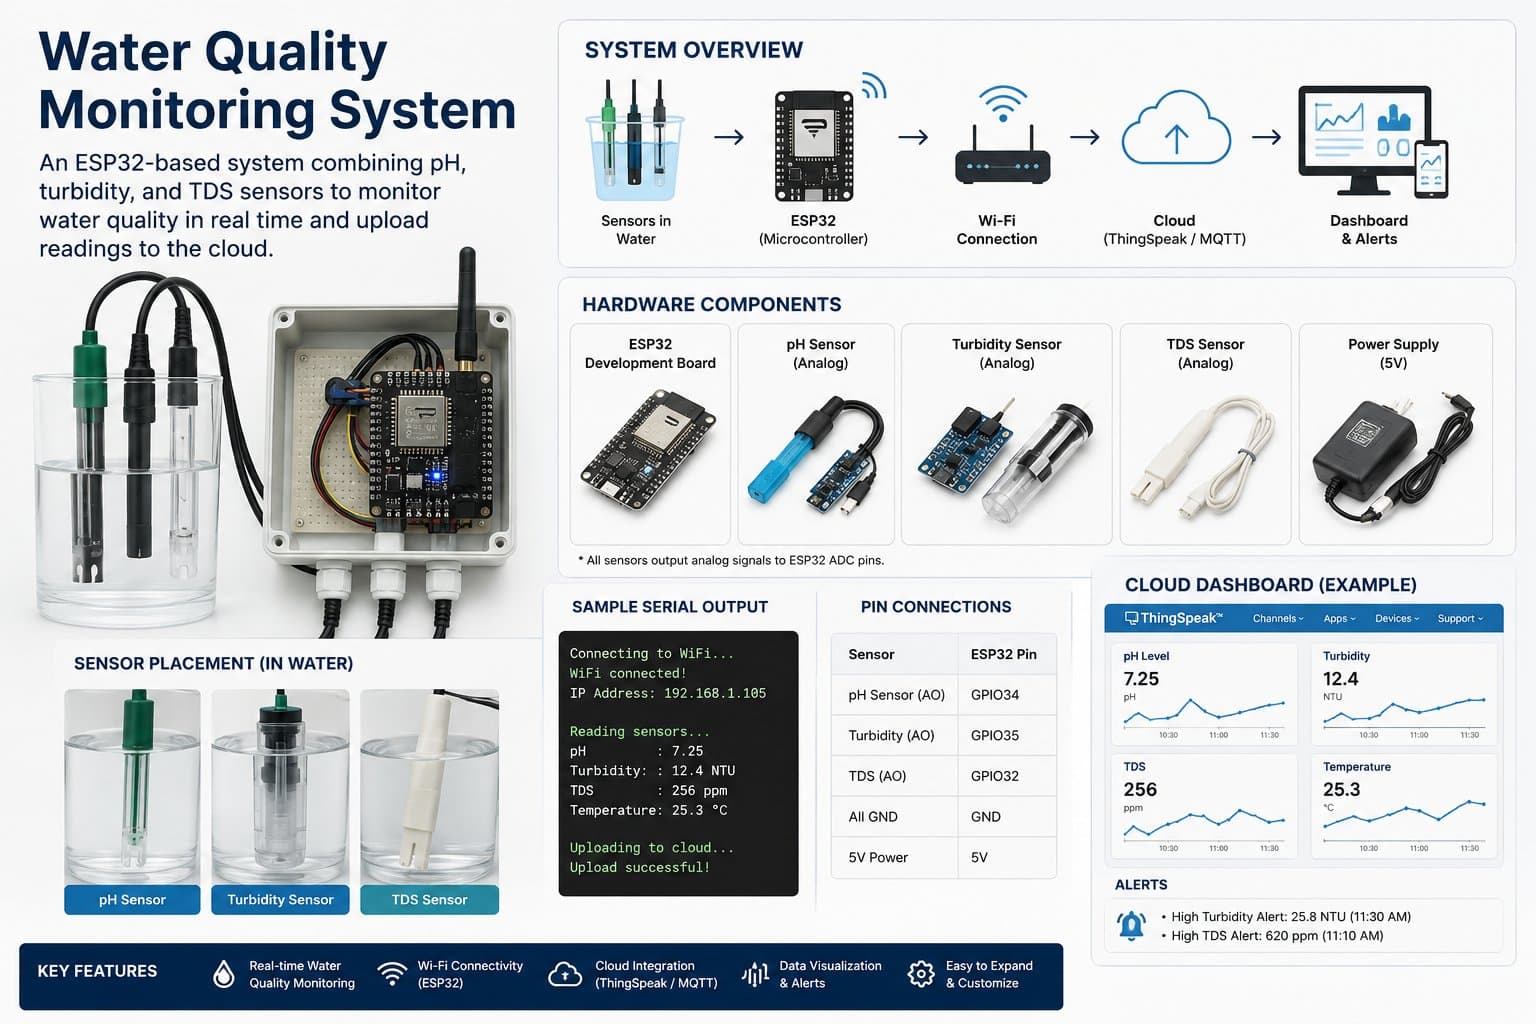
This final part focuses on testing data after publishing over MQTT and pointing toward integrating a real-time dashboard.
7.1. Testing with MQTT Explorer
Open MQTT Explorer and connect to the broker:
Host: 192.168.1.50
Port: 1883
Username: if applicable
Password: if applicable
Then check the topic:
iotlabs/water/water-monitor-001/#7.2. Testing with mosquitto_sub
mosquitto_sub -h 192.168.1.50 -t "iotlabs/water/water-monitor-001/#" -v7.3. What Should a Dashboard Include?
| Component | Content |
|---|---|
| Current Status | NORMAL / WARNING / DANGER / SENSOR_ERROR |
| pH Card | The current pH value. |
| TDS Card | The TDS value in ppm. |
| Turbidity Card | Relative turbidity. |
| Temperature Card | Water temperature. |
| Realtime Chart | A chart over time. |
| Alert History | Alert history. |
| Device Health | RSSI, uptime, free heap. |
7.4. Suggested Node-RED Flow
[mqtt in]
  → [json parser]
  → [dashboard gauge/chart]
  → [function check alert]
  → [telegram/email]
7.5. Completion Checklist
- The ESP32 can read all sensors.
- The Serial Monitor shows the correct data.
- The pH and turbidity sensors have basic calibration.
- The ESP32 connects to WiFi and MQTT successfully.
- MQTT Explorer receives telemetry, status, alert, and heartbeat messages.
- The LED/buzzer respond correctly to water status.
7.6. Extension Ideas
- Add an OLED for local display.
- Store data in MySQL/PostgreSQL/InfluxDB.
- Build a real-time dashboard with Node-RED, ThingsBoard, or a custom web app.
- Add OTA for remote firmware updates.
- Design a waterproof enclosure and offline logging for when the network drops.