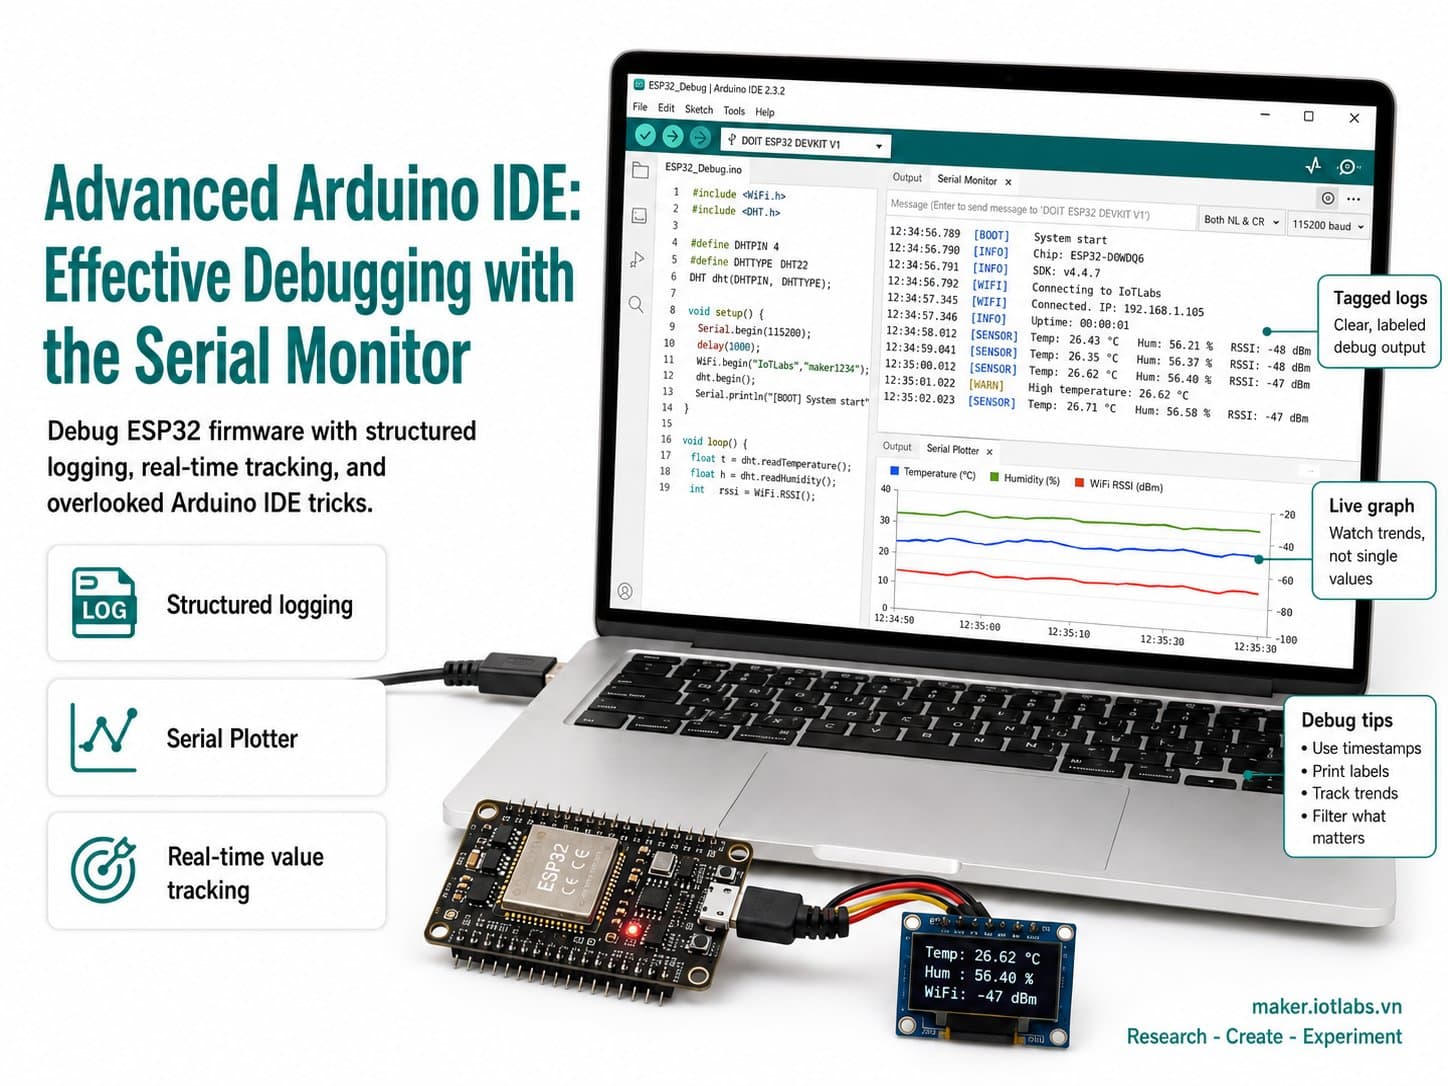
Advanced Arduino IDE: Effective Debugging with the Serial Monitor
Debugging techniques for ESP32 firmware using the Serial Monitor and Serial Plotter: placing logs where they matter, reading compiler errors, tracking DHT22 sensor values in real time, and debugging tricks that get overlooked in the Arduino IDE.
Most IoT bugs aren't hardware problems — they come from not being able to see what the program is actually doing. This guide shows how to debug effectively with the Arduino IDE's Serial Monitor and Serial Plotter, using a DHT22 temperature/humidity firmware on ESP32 as the running example: from boot-status logging and detecting a disconnected sensor, to plotting values in real time.
Detailed guide
Debugging techniques for ESP32 firmware using the Serial Monitor and Serial Plotter: structured logging, real-time value tracking, and debugging tricks that get overlooked in the Arduino IDE.
1. Introduction
Most IoT bugs aren't hardware problems — they come from not being able to see what the program is actually doing. The ESP32 has no screen and no breakpoints like desktop programming does; your main debugging tools are the Arduino IDE's built-in Serial Monitor (text log output) and Serial Plotter (real-time graphs of numeric values). This guide shows how to use both tools effectively, using a DHT22 temperature/humidity firmware on ESP32 as the running example.
2. Components Needed
| Component | Qty | Reference Price |
|---|---|---|
| ESP32 DevKit V4 (ESP32-WROOM-32) | 1 | ~75,000 - 120,000₫ |
| DHT22 (AM2302) sensor | 1 | ~45,000 - 70,000₫ |
| Female-to-male jumper wires | 3 | ~5,000₫ |
3. Wiring Diagram
| DHT22 | ESP32 DevKit V4 |
|---|---|
| VCC | 3V3 |
| GND | GND |
| DATA | GPIO4 |
Power the DHT22 with 3.3V, not 5V — its DATA pin talks directly to the ESP32's 3.3V GPIO.
4. Three Rules for Debugging over Serial
- Always print a "boot banner": the first log line right after
Serial.begin()confirms the program actually restarted, rather than hanging silently. - Give your logs structure: tag them with
[INFO]/[WARN]/[ERROR]instead of printing raw values — once a log runs hundreds of lines, you need to be able to scan it quickly. - Keep numeric data separate from text logs: the Serial Plotter can only graph lines formatted as
label:valuepairs separated by commas — don't mix in descriptive text on the same line.
Open the Serial Monitor via Tools → Serial Monitor (or Ctrl+Shift+M), and set the baud rate to match Serial.begin() in your code (115200 here). Open the Serial Plotter via Tools → Serial Plotter (or Ctrl+Shift+L) — it automatically recognizes label:value pairs in the printed lines and plots each one as a separate line.
5. Example #1 — Structured [INFO]/[WARN]/[ERROR] Logging
enum LogLevel { LOG_INFO, LOG_WARN, LOG_ERROR };

void logMsg(LogLevel level, const String &msg) {
  switch (level) {
    case LOG_INFO:  Serial.print(F("[INFO] ")); break;
    case LOG_WARN:  Serial.print(F("[WARN] ")); break;
    case LOG_ERROR: Serial.print(F("[ERROR] ")); break;
  }
  Serial.println(msg);
}
A small log helper like this keeps every debug line in the project consistently formatted — when you copy the log to send to someone else for help, they can instantly filter for critical errors with Ctrl+F "[ERROR]".
6. Example #2 — A Data Line for the Serial Plotter
// Dinh dang danh cho Serial Plotter: "ten:gia_tri,ten:gia_tri"
Serial.print(F("Temp_C:"));
Serial.print(tempC);
Serial.print(F(",Humidity_pct:"));
Serial.println(humidity);
Printed in this exact format, the Serial Plotter will automatically draw two live lines — Temp_C and Humidity_pct — on the same chart. This makes it easy to spot a DHT22 producing erratic spikes (signal noise) or a flat, unchanging reading (a broken sensor or loose wire) — patterns that are hard to catch just by staring at a column of numbers.
7. Example #3 — Complete Debug Firmware with Disconnect Detection
// proj2_debug.ino - Debug hieu qua bang Serial Monitor + Serial Plotter (Arduino IDE)
// Board: ESP32 DevKit V4  |  Cam bien: DHT22 tren GPIO4
#include <DHT.h>

#define DHT_PIN 4
#define DHT_TYPE DHT22

DHT dht(DHT_PIN, DHT_TYPE);

enum LogLevel { LOG_INFO, LOG_WARN, LOG_ERROR };

void logMsg(LogLevel level, const String &msg) {
  switch (level) {
    case LOG_INFO:  Serial.print(F("[INFO] ")); break;
    case LOG_WARN:  Serial.print(F("[WARN] ")); break;
    case LOG_ERROR: Serial.print(F("[ERROR] ")); break;
  }
  Serial.println(msg);
}

unsigned long lastReadAt = 0;
const unsigned long READ_INTERVAL_MS = 2000;
uint8_t consecutiveFailures = 0;

void setup() {
  Serial.begin(115200);
  delay(300);

  Serial.println();
  Serial.println(F("======================================"));
  Serial.println(F(" ESP32 + DHT22 - Debug Demo"));
  Serial.println(F(" Serial Monitor: xem log [INFO]/[WARN]/[ERROR]"));
  Serial.println(F(" Serial Plotter: xem 2 duong Temp_C, Humidity_pct"));
  Serial.println(F("======================================"));

  dht.begin();
  logMsg(LOG_INFO, F("dht.begin() done, cho cam bien on dinh..."));
}

void loop() {
  unsigned long now = millis();
  if (now - lastReadAt < READ_INTERVAL_MS) {
    return;
  }
  lastReadAt = now;

  float humidity = dht.readHumidity();
  float tempC = dht.readTemperature();

  if (isnan(humidity) || isnan(tempC)) {
    consecutiveFailures++;
    logMsg(LOG_WARN, "Doc DHT22 that bai (lan thu " + String(consecutiveFailures) + ")");
    if (consecutiveFailures >= 5) {
      logMsg(LOG_ERROR, F("5 lan doc lien tiep that bai - kiem tra day noi VCC/GND/DATA"));
    }
    return;
  }
  consecutiveFailures = 0;

  Serial.print(F("Temp_C:"));
  Serial.print(tempC);
  Serial.print(F(",Humidity_pct:"));
  Serial.println(humidity);

  logMsg(LOG_INFO, "Doc thanh cong -> " + String(tempC, 1) + " C / " + String(humidity, 1) + " %");
}
Notice the consecutiveFailures counter: logging a single failed read and moving on is easy to miss, but if 5 reads in a row all fail, that's almost certainly a loose DATA wire or a dead sensor — at that point the log should escalate from [WARN] to [ERROR] so it's easy to spot while scrolling through hundreds of log lines.
8. Common Issues
| Issue | Cause | Fix |
|---|---|---|
| Serial Monitor shows garbled characters (mojibake) | The Serial Monitor's baud rate doesn't match Serial.begin() | Set the baud rate in the Serial Monitor's bottom-right dropdown to match the code (115200) |
| The Serial Plotter doesn't draw any lines | The printed line mixes descriptive text with label:value pairs, or is missing commas between pairs | Keep the Plotter's data line completely separate from descriptive log lines, in the exact format name:number,name:number |
| Can't open the Serial Monitor — "port busy" error | Another program (a Python script, another IDE) is holding the COM port | Close every other program using that COM port before reopening the Serial Monitor |
| No log output appears even though the code has Serial.print calls | Missing Serial.begin() in setup(), or the board just reset and hasn't had time to print yet due to a missing short delay() after begin() | Make sure Serial.begin(115200) is the first call in setup(), and add a delay(300) before printing any logs |
9. Summary
The Serial Monitor and Serial Plotter are two free, built-in debugging tools that often get used superficially — just printing raw values with no status logging. Adding a boot banner, tagging log levels, and keeping the Plotter's data line separate are three small habits that can save you hours of guesswork when firmware "isn't working right" and you can't tell why.